Web browsers nowadays have advanced capabilities used by UI developers. These advanced capabilities are available in the form of Developer Tools that each Web browser supports. But the question arises, why does one need to use the Developer Tools feature.
Why do Inspect elements?
User Experience is one of the topmost priorities of websites. Mobile responsiveness, error/exception handling and any scenario where the UI is breaking upon the user taking any action on the website. To figure out where things break quickly, inspecting elements is very useful.
What does the Inspect element do?
- Image size – Images available on websites are key elements. To determine the image size on the fly, the “inspect element” is helpful.
- Mobile Responsiveness – To check whether the website is mobile responsive or not, the inspect an element is a key tool.
- Styling and Formatting – To check the styling of UI widgets, the font size used, font family used – all can be found through this tool. To obtain HTML colour code, you can quickly find out.
To do experiments with colours and styling, make changes in this tool and view how it looks. If the change looks good, then it can be implemented live. - Request – Response Structure – Whenever there is an error found on clicking any action button on the website, the Network tab is used to determine the response with data structure and figure out why the error is occurring.
There are many more features and functionality available in the Developer Tools. The “Inspect Element” is one of the options in the Developer Tools of the Web browser that opens a panel with different tabs and content.
Also read:
- 8 Short tips and tricks for Mac owners
- How to install Rust installer on Mac
- How to protect Mac from malware and virus
- How to open RAR and Zip on Mac
- How to take screenshot in Mac Air
How to Inspect Elements on Mac
- Open a Web browser. For example Google Chrome
- Go to a specific website – www.strangehoot.com
- Click the post to open the page.
- To open the Inspect Element panel:
- Right-click to open the context menu.
- Pick Inspect from the list.
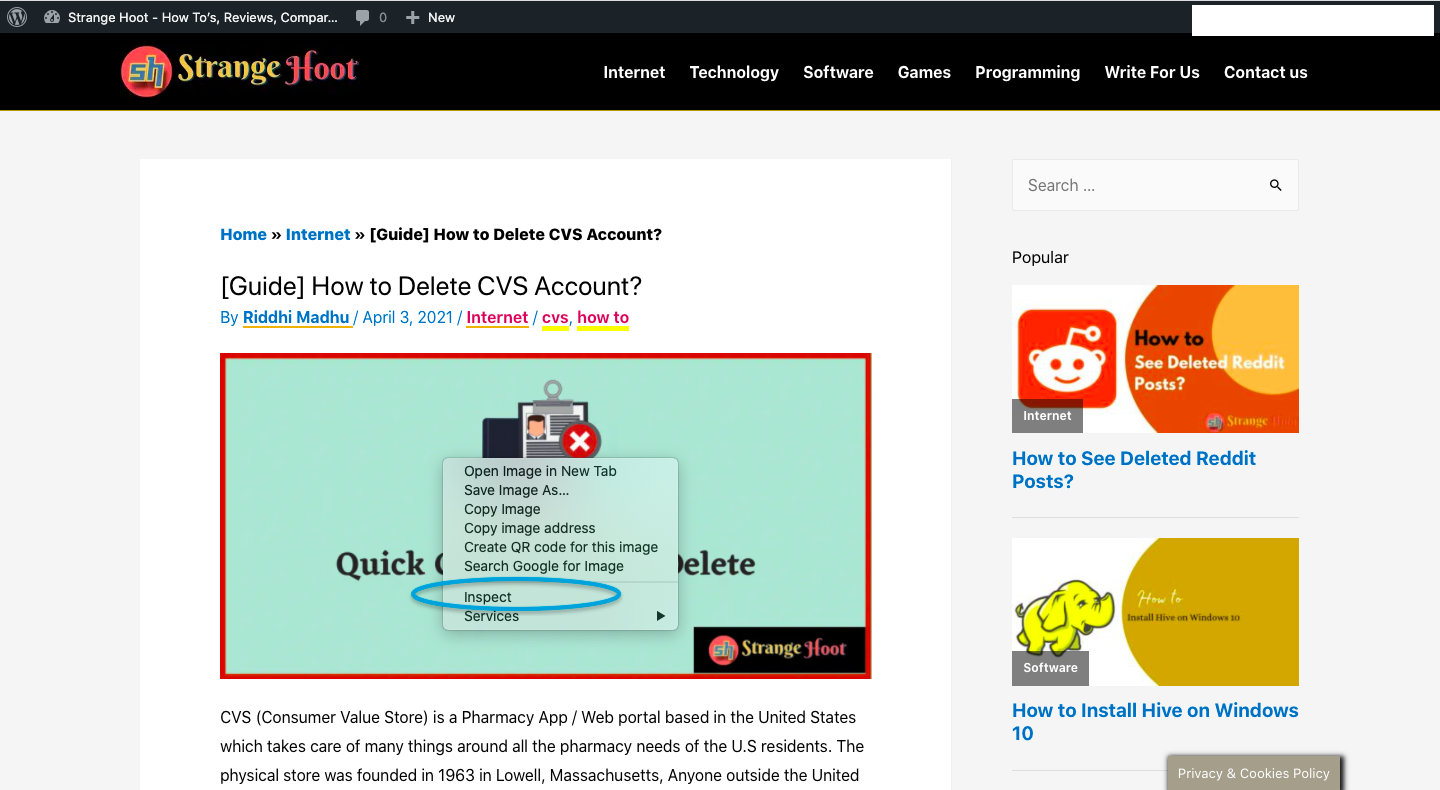
- The below panel shall be shown with a list of horizontal tabs.

- To obtain the image size, use the first icon with arrow (selection) and hover over the image.

- The image size is visible on the callout box that appeared. The size is – 651.94px * 325.97px.
- Along with that, the margin set and other information is also shown as image details.
- To view the request-response structure, the Network tab is used.

- The request taking more time to load can be determined from here.
- This tab also is used to find the response structure. This is how you do it.
- Click the call from the Name section. On the right side, details related to that call are shown.
- Go to the Response tab on the right. The data structure details shall be shown.

- While debugging the call request-response, it is better to tick the Preserve logs check box.
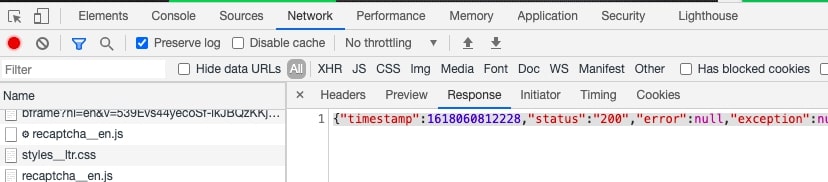
- This helps in debugging if any error or exception is thrown.
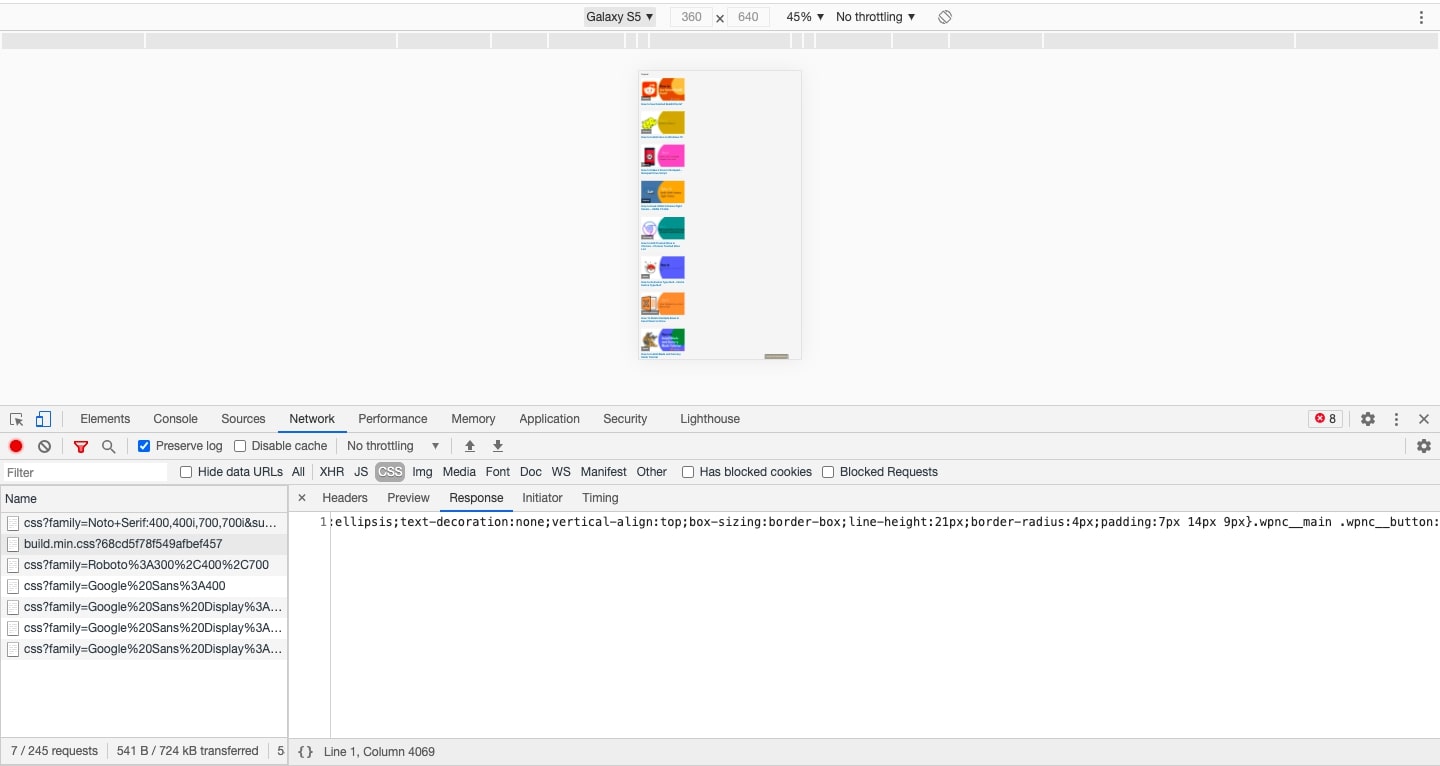
- To view the site’s mobile responsiveness, use the device toggle bar icon located next to the selection tool.
- The mobile layouts can be chosen if the view is appropriately shown in the mobile view or not.
Takeaway
There are many more features available for developers to debug, improve UI quality and fix the UI issues quickly and efficiently. The Developer Tools has become an integral part of the development and testing process.
